Tempsens
Developed the entire fullstack Sirowa warehouse temperature monitoring web application named Tempsens to monitor product storage compliance with temperature requirements. Monitoring is required by Ravimiamet for storage of medicinal goods.
Two types of Comet sensors are used: stationary and portable. Stationary sensors connect to Tempsens SOAP API. Portable sensors can be connected to a user’s machine via mini-USB. Sensor data can then be downloaded as a CSV file through the Comet Vision application. The CSV can subsequently be uploaded in the Tempsens front-end application, which uses a REST API internally for saving the parsed data.
Data flow diagram
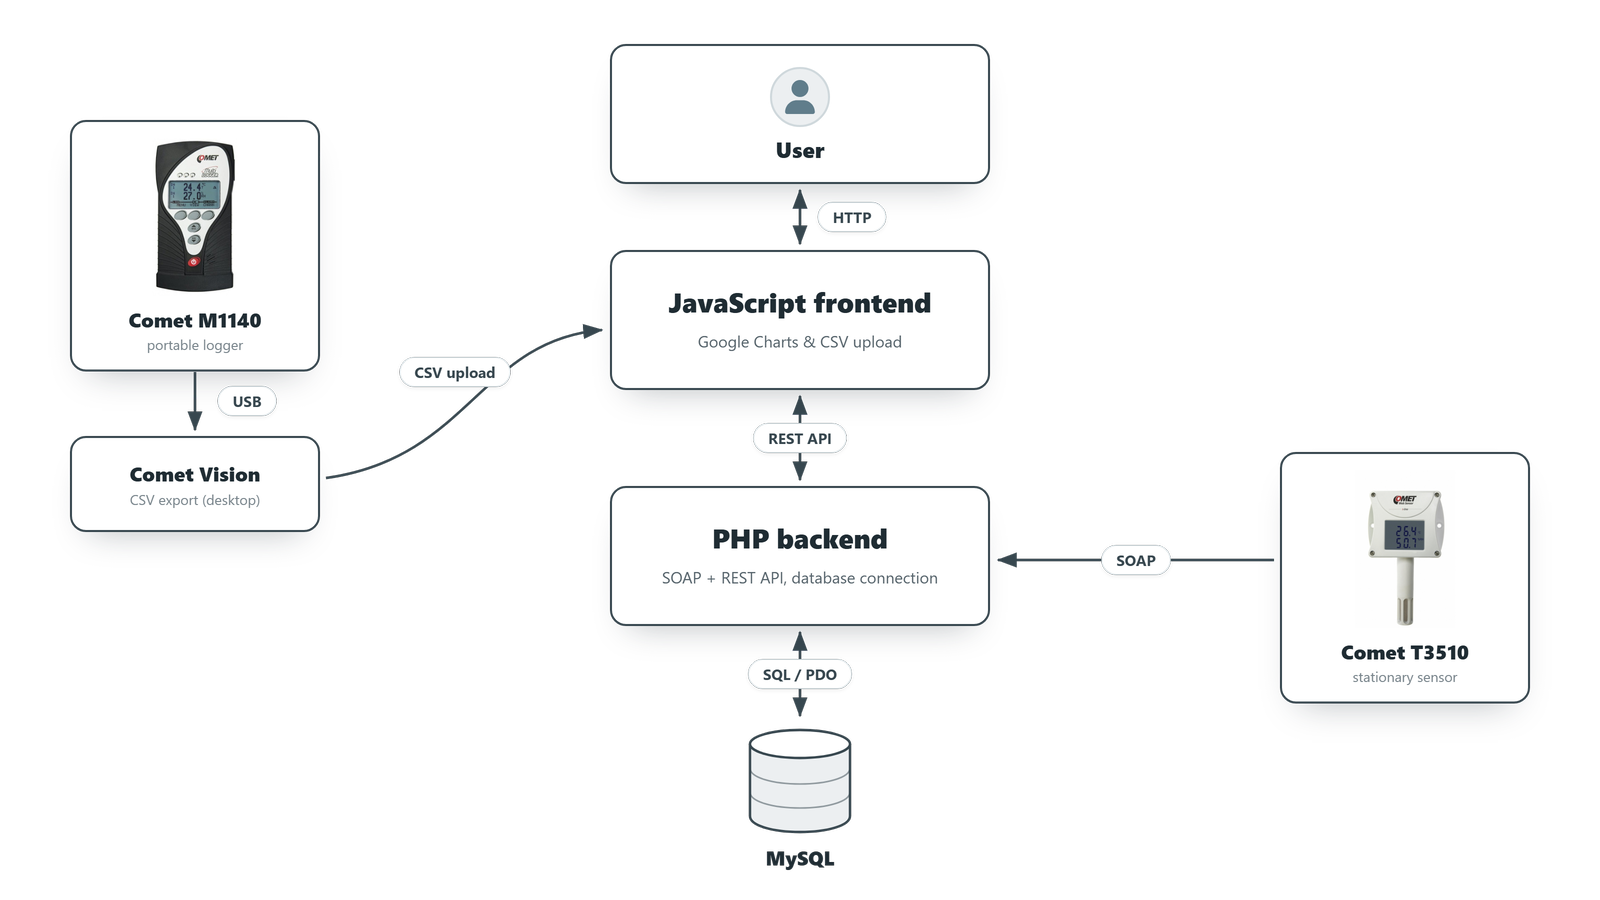
Flow of the application for stationary sensors consists of data being sent to the Tempsens application through the SOAP API and the application in turn saving it to a MySQL database. Mobile sensors do not have a SOAP interface and require users to upload CSV files through the Tempsens application. A mini-USB and Comet Vision application are required to download the CSV file from a portable sensor.
The application flow for the user is based on initial server-side rendering and subsequent JavaScript-based interactivity. For the user this means that when loading the selected period of data, the entire page will be refreshed. Site interactivity logic allows:
- Uploading CSV data and saving it into a database through the backend via the REST API standard.
- Defining visualization settings and behavior for chart drawing.
- Visualizing a line chart according to user settings.
- Downloading chart image PNG and sensor data CSV.
Internally, sensor create, update and delete operations and uploading parsed CSV data are implemented using the REST API standard. The application routing is implemented with the Slim library and charting is done with Google Charts. Bootstrap is used for interactivity like modals and collapsible elements.
Algorithms
Application uses binning and clustering algorithms to help visualize data.
Binning serves both technical and user-specific needs. The binning algorithm creates uniform period buckets that contain multiple sensor readings. This speeds up chart drawing time for large periods and also increases resulting chart readability. The buckets also allow different visualization behavior like average value, most extreme value and show alert (value 0) on missing value.
const getBuckets = (dateFrom, dateTo, step) => {
    let buckets = [];
    let bucketCurrentDate = dateFrom;
    for (let i = 1; ; i++) {
        let bucketNextDate = dateFrom.add(step * i, 'minutes');
        if (bucketNextDate >= dateTo) break;
        buckets.push({
           startDate: bucketCurrentDate,
           endDate: bucketNextDate,
           row: []  // will contain y value of the bucket for selected sensors
        });
        bucketCurrentDate = bucketNextDate;
    }
    return buckets;
}
Large data sizes demand bucket filtering operation to be optimized. This means reducing time complexity from O(n^2) to O(n) by making use of ordered array properties.
for (let sensor of sensors) {
    let lowRef = { value: 0 }; // pass by reference trick
    for (let { row, startDate, endDate } of buckets) {
        let rowValues = filterArrBetween(sensor.readings, startDate, endDate, lowRef);

        // ... omitted derive one value from rowValues and add to row
    }
}
function filterArrBetween(sortedByDateObjArr, before, after, lowRef) {
    // sortedByDateObjArr.filter(x => before <= x.date && after > x.date);  // too slow
    let result = [];
    while (lowRef.value < sortedByDateObjArr.length) {
        let obj = sortedByDateObjArr[lowRef.value];
        if (after <= obj.date) break;
        if (before <= obj.date) result.push(obj);
        lowRef.value++;
    }
    return result;
}
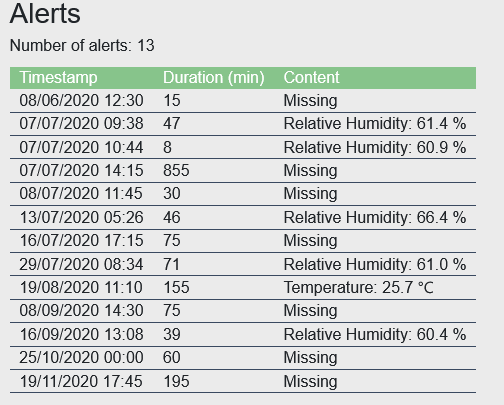
Clustering allows chaining multiple readings for a more accurate way to show sensor alerts for both ‘value out of bounds’ errors and ‘missing value’ errors.
function createChain(array $sortedByDateObjArr, callable $isPartOfSameChainFn): array {
    $result = [];
    $chain = [];
    // ... omitted special cases for size 1 and 0
    for ($i = 0; $i < sizeof($sortedByDateObjArr) - 1; $i++) {
        $current = $sortedByDateObjArr[$i];
        $next = $sortedByDateObjArr[$i + 1];
        $isPartOfSameChain = $isPartOfSameChainFn($current, $next);
        $state = match (true) {
            $isPartOfSameChain => "isPartOfSameChain",
            sizeof($chain) > 1 && ! $isPartOfSameChain => "isPartOfChainBreak",
            sizeof($chain) === 0 && ! $isPartOfSameChain => "isNotPartOfChain",
        };
        $isLast = $i === sizeof($sortedByDateObjArr) - 2;

        switch ($state) {
            case "isPartOfSameChain":
                // leads to isPartOfSameChain or isPartOfChainBreak
                if (empty($chain)){ $chain[] = $current; }
                $chain[] = $next;
                if ($isLast) { $result[] = $chain; }
                break;
            case "isPartOfChainBreak":
                // leads to isPartOfSameChain or isNotPartOfChain
                $result[] = $chain;
                $chain = [];
                if ($isLast) { $result[] = [$next]; }
                break;
            case "isNotPartOfChain":
                // leads to isPartOfSameChain or isNotPartOfChain
                $result[] = [$current];
                if ($isLast) { $result[] = [$next]; }
                break;
        }
    }
    return $result;
}
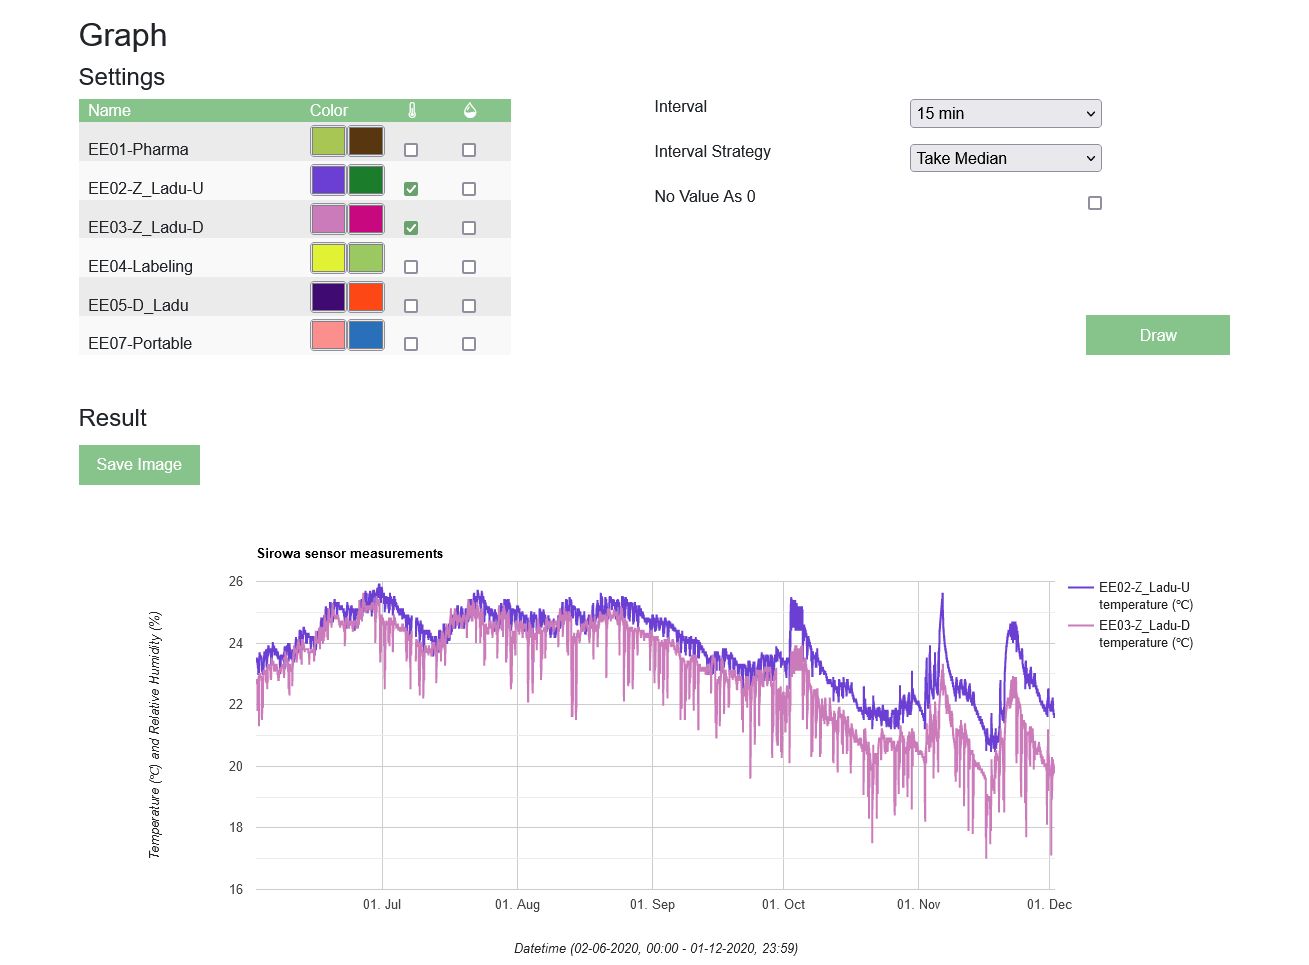
This is what the final result looks like in the UI.
Last words
The finished application solved all business requirements needed to overview warehouse temperature.
Although it looked like a relatively simple application at first, the amount of code needed to display a chart proved shocking. The algorithms needed to solve user needs certainly proved to be an interesting and rewarding challenge to solve.